Restructuring Activity Stays Elevated Even as Recession Seems Less Likely
-
May 07, 2024
Downloads Download Article
-

It is impossible to reflect on the current state of the U.S. economy without recognizing how off the mark recession calls have been since 2022. It was only a year ago that two-thirds of economists regularly polled by Bloomberg expected a U.S. recession within a year. Even today that percentage is still a lofty 30%, though scant evidence of an impending downturn is found in macroeconomic data or in plain sight, notwithstanding the weaker-than-expected advance GDP report for 1Q24. It’s not just economists who have been errant in this call. Credit markets have gotten it wrong too, with the yield between two-year and 10-year Treasuries running negative for two years. That particular yield curve inversion has been a widely followed indicator of recession for decades, but not this time — at least not yet. The U.S. economy is not entirely out of the woods with respect to a recession scenario, but even if such an outcome were to materialize in late 2024 or 2025, it would hardly vindicate those making this call since 2022. There is an adage that says somebody who keeps making the same prediction eventually will be right.
Nearly two years of the most aggressive monetary tightening by the Fed since the Volcker years of the early 1980s has failed to sufficiently slow the U.S. economy in the aggregate or slay the inflation dragon, though pockets of the domestic economy certainly are hurting. U.S. GDP real growth estimates for 2024 consistently have been revised upward since late 2023 — to 2.4% currently — and it is widely agreed that the U.S. economy is outperforming most industrialized nations even with interest rates near two-decade highs. These aren’t stellar growth results or high expectations but certainly they are respectable, all things considered. Economists and markets alike are long known to overpredict recessions,1 so this benign backdrop is not entirely surprising. However, if ever all the ingredients were in place for economic stagnation or downturn it was during the last two years, so the resilience of the U.S. economy in the face of these multifront challenges is impressive.
Recessions Have Changed a Lot Over Time
There are documented instances of domestic recessions dating back to shortly after our nation’s founding, when they often were referred to as “panics” due to triggering events in the banking sector, financial markets or other speculative activity that typically set-off contractionary economic behavior among businesses and financial institutions. These panics could endure for a couple of years until confidence was restored for economic decision-makers. However, the “modern age” of measuring the U.S. economic cycle and its vagaries begins in 1854, which is how far back the National Bureau of Economic Research (or NBER, the arbiter of the economic cycle) documents and dates episodes of recession.
There have been 34 U.S. recessions recognized by the NBER since 1854, with 23 of them occurring prior to 1950, or approximately one every 4.2 years during that 96-year period, lasting an average of 20 months. The post-WWII period is a different story, with just 11 recessions declared by the NBER in the last 75 years, each lasting an average of 10 months. It is widely recognized that recessions have occurred less frequently and less severely in the postwar period compared to the preceding nine decades, as the banking system and financial markets became more sophisticated while increasing government regulation of banks and markets curbed the speculative excesses that often precipitated economic downturns prior to the Great Depression. In general, pre-Depression Era recessions bear little resemblance to postwar downturns and offer few relevant object lessons other than historical context for policymakers navigating today’s modern economy.
Less discussed is how dramatically the U.S. economic cycle has changed since 1990 compared to the first 40 years of the postwar period, with the frequency of recessions decreasing notably in recent decades: seven downturns occurred from 1950 to 1989 versus four since 1990 — one of which was the pandemic-induced recession of 2020, the shortest on record at just three months. Two of the three longest economic expansion periods on record have occurred since 1990, each of them stretching out a decade, which is unprecedented in our nation’s history. Working-age people today are conditioned to think of recessions as rare events, but that wasn’t always true — far from it.
There are some discernible reasons for improved economic stability since 1990, including the maturation of the U.S. economy, technology-driven productivity gains, the country’s continuing transition to a services-based economy, the taming of inflation (prior to 2021), steadily declining interest rates for three decades and, controversially, massive monetary stimulus since 2009. All have contributed to the stability and resilience of the U.S. economy over these last three decades.
However, along with greater stability came more restrained growth. The U.S. economy in this century has struggled to achieve 3.0% real GDP growth, long considered the hurdle rate of healthy economic growth, hitting that mark or better in just 36 of 96 quarters since 2000 compared to 55 times in the preceding 24-year period. Real GDP growth has averaged 2.5% since 1990 compared to 3.4% from 1950 to 1990, representing a significant slowing of annual growth even as the domestic economy embraced the tech boom that persists to this day. Economists have puzzled over this phenomenon of slowing GDP growth amid the information technology revolution, and there are few obvious explanations. It may just be that slower growth is the other side of the coin in an economy that exhibits less volatility overall (Figure 1).
Figure 1 - U.S. Real GDP Growth
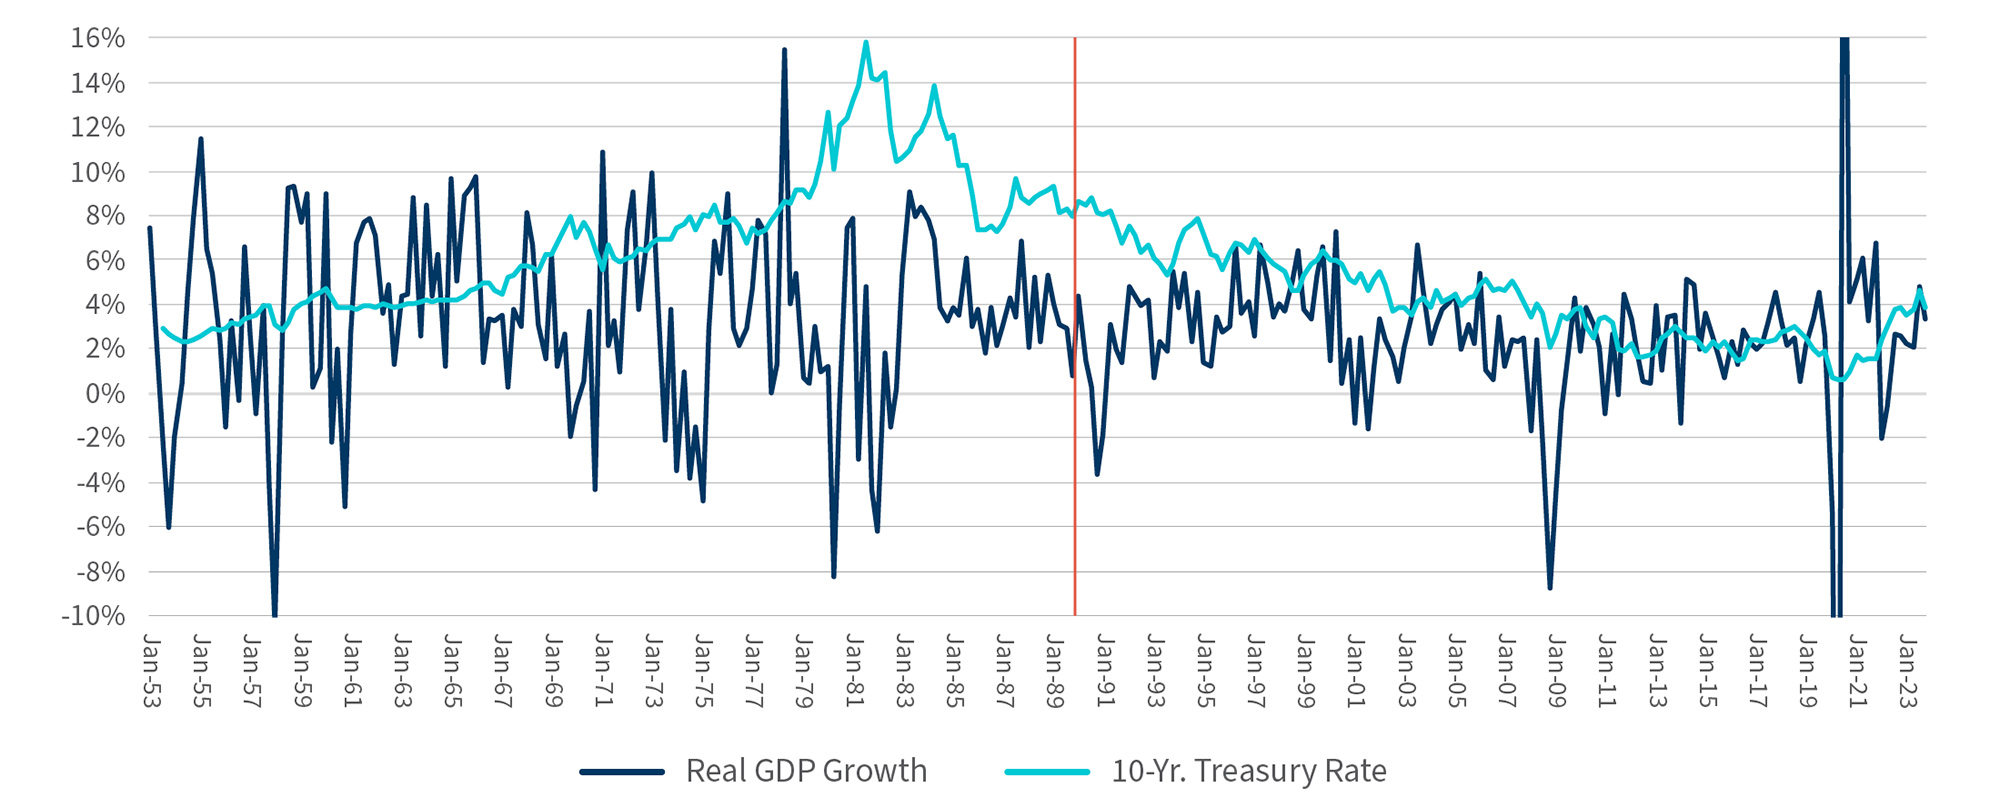
Source: Federal Reserve Economic Data (FRED), the St. Louis Fed.
Note: Growth represents annualized consecutive real quarterly growth.
Despite slowing macroeconomic growth, the U.S. corporate sector has fully asserted itself in recent decades. Corporate profits as a percentage of national income (the GDP equivalent expressed as the sum of cumulative wages, rents, income and profits) has trended higher for three decades and sits near an all-time high after languishing at record lows during the 1980s (Figure 2). This turnaround is attributable to renewed American competitiveness in the global marketplace since the 1990s, as well as soaring global trade, the dominance of American companies in service industries such as financial services and software-driven products and solutions that are utilized globally, and the scalability of many technology businesses.
Figure 2 - Corporate Profits as a Percent of National Income
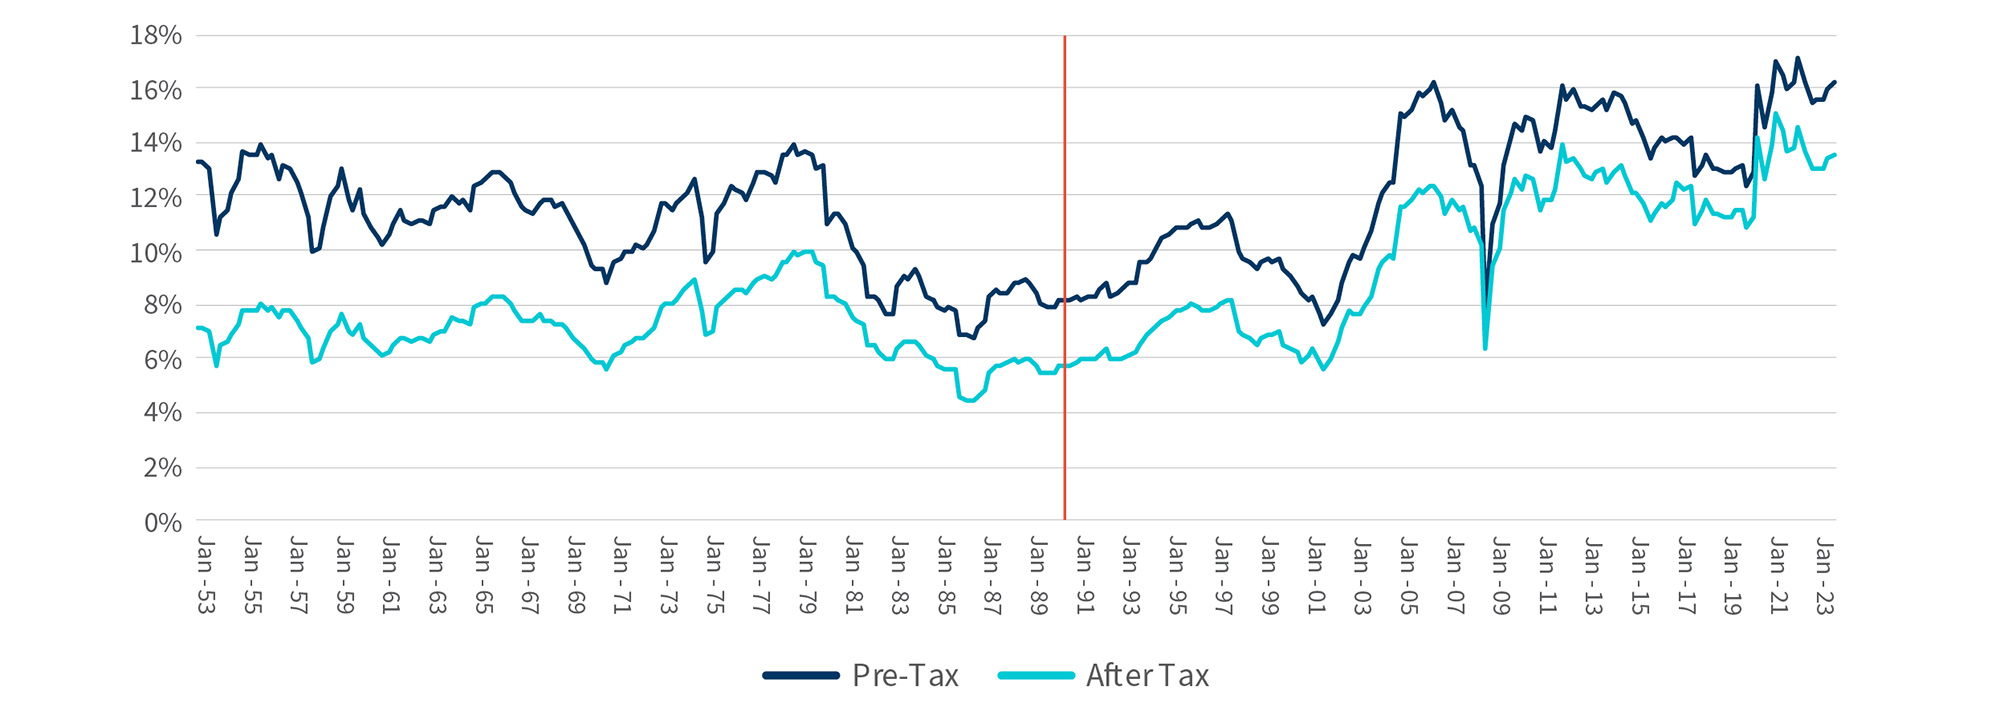
Source: FRED, the St. Louis Fed.
Robust Restructuring Activity Doesn’t Need a Recession Nowadays
In his recent annual letter to shareholders, JP Morgan CEO Jamie Dimon opined on a variety of topics, including his concern about the growing influence of proxy advisors, shareholder activists and onerous reporting requirements on public companies. In doing so, he cited a couple of factoids that really caught our attention, stating that there are just 4,300 U.S. public companies today compared to a peak of 7,300 in 1996, a 40% decrease, while the number of U.S. companies owned by private equity firms has increased from 1,900 to 11,200 in the last 20 years,2 a CAGR of 9.3%. Such a formidable growth rate represents significant market share gains for private equity within the large corporate landscape. Private equity’s ascendance in this century has altered corporate decision-making and capital structure allocations.
Corporate restructuring activity has always been dependent on turns of the economic cycle, which is intuitively understood, but the degree of that dependence has been changing. Large businesses, recognizing the opportunities of improved economic stability and sustained profitability, have been comfortable employing more leverage this century, especially in the past decade, and credit markets have been more than accommodating in this pursuit. Corporate leaders essentially have been willing to trade off reduced operating risk for more financial risk in recent years, and until 2022 it was a profitable trade-off for the most part with respect to shareholder returns and deal activity.
Consequently, U.S. LBO transaction multiples steadily increased from 9.5x EBITDA in 2010-2013 to 13x in 2019-2022, while total leverage employed was 7x EBITDA for a majority of large buyout deals done in those recent years,3 mostly in floating-rate loans. These are leverage levels only reached previously in 2007 just prior to the global financial crisis. We’re talking about nearly 1,000 large buyout transactions completed in 2018-2022, many of which are now trying to navigate an economic and credit environment that’s much less supportive of aggressive deal structures. More broadly, S&P reports that global speculative-grade corporate debt has reached $5.2 trillion, an increase of 24% since 2018, more than 60% of which derived from U.S.-based issuers.4
High interest rates continue to drain liquidity from corporate coffers with little rate relief in sight over the balance of the year, a reversal of most expectations going into 2024. The increasing number of liability management exercises (LMEs) done since 2022 reflect desperate attempts of highly leveraged borrowers to raise capital or extend maturities on struggling deals done mostly during the go-go years. Looking ahead further, there is little chance we will return to the ultra-low-rate environment engineered by the Fed and other central banks during the peak years of quantitative easing, as the moral-hazard consequences of those policy actions have become evident to policymakers while the effectiveness of further QE initiatives to stimulate economic growth without significant blowback is problematic.
If 2023 showed us anything, it is that elevated levels of bankruptcies and other restructuring activity don’t require a recession. Ignoring the pandemic year of 2020, large Chapter 11 filings in 2023 were the strongest since 2010, when the economy was still contending with the effects of the global financial crisis, and restructuring activity in 2024 has held up well to date. One-quarter of large Chapter 11 filings in 2023 and 1Q24 were sponsor-owned companies — a proportion that would have been larger were it not for all the distressed exchanges and LMEs done. (Sponsor-owned companies accounted for nearly one-third of large filings in 2016-2020 before LMEs and distressed exchanges became so prevalent.) The private equity industry has long pushed back against the assertion that the failure rate of sponsor-owned companies is any larger than corporate failure rates generally. The first real test of that belief is underway — recession or not.
Footnotes:
1: “Quote Origin,” Quote Investigator (November 1, 2023).
2: Jamie Dimon, “Chairman & CEO Letter to Shareholders,” JPMorgan Chase & Co (April 8, 2024).
3: “LPC’s Leveraged Loan Monthly,” LSEG (January 2024).
4: “Q2 2024 Global Refinancing Update: Window of Opportunity May Be Closing,” S&P Global Ratings (April 24, 2024).
Related Insights
Related Information
Published
May 07, 2024
 Key Contacts
Global Co-Leader of Corporate Finance & Restructuring